Start with unusual volume
Each scan date lists only tickers that showed an abnormal volume ratio versus their own baseline — not the whole market.


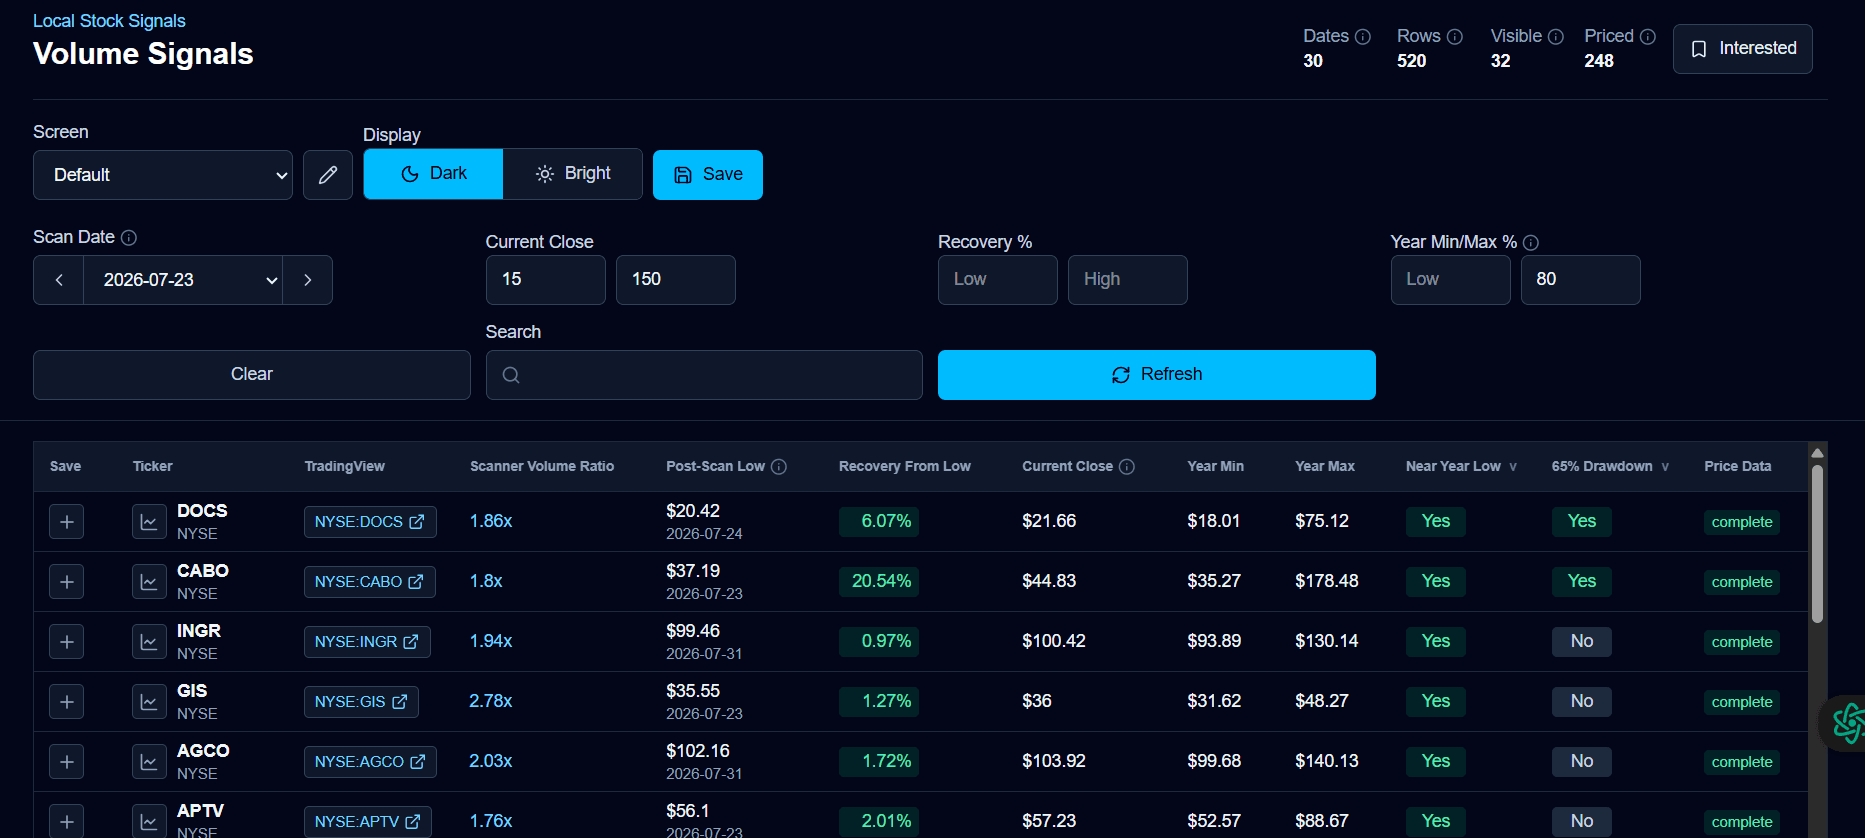
Analyze scanner-qualified tickers post-volume event: current close, low, recovery, yearly range, and signal flags in one workspace.

HOW IT WORKS
Each scan date lists only tickers that showed an abnormal volume ratio versus their own baseline — not the whole market.
Post-scan low, recovery from that low, current close and yearly range are calculated for every row automatically.
Apply price, recovery, drawdown and year-range filters, then save the screen so tomorrow's scan opens ready to work.

KEY BENEFITS
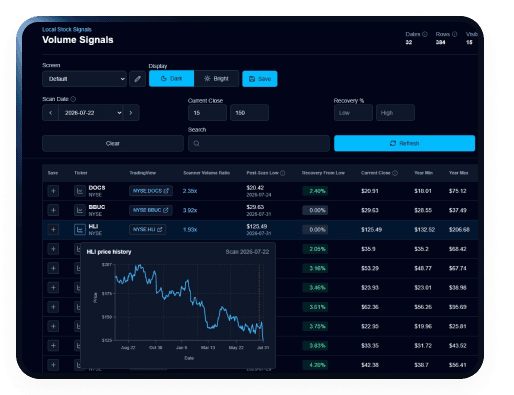
Hover any ticker for a full adjusted-close history chart with the scan date marked in place.
Cover hundreds of scanner-qualified rows per date instead of opening charts one ticker at a time.
Step backwards and forwards through scan dates to see how a cohort of signals actually behaved.
Keep your preferred filter set as a named screen and reload it in one selection.
Every row carries the price path after the event, so you can judge whether the move already happened.
Near-year-low, deep-drawdown and recovery flags let you express a screening thesis in a few clicks.
PRODUCT WALKTHROUGH
Real screens from the research workspace — the same view you get after creating a free account.
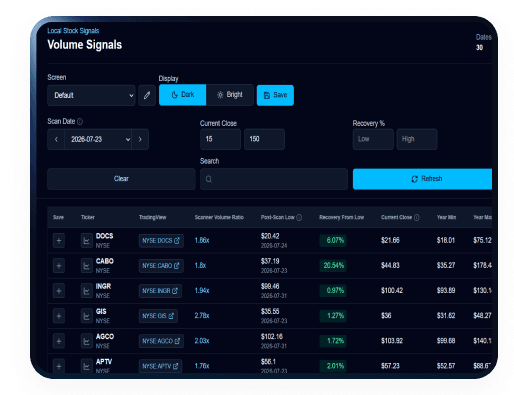
Volume ratio, post-scan low with its date, recovery from low, current close and the 52-week band sit side by side — no tab switching, no spreadsheet export.
Hovering a ticker opens its adjusted close history with the scan date marked, so you can confirm the shape of the move before adding it to a shortlist.

RESEARCH METHODOLOGY
Nothing here is a prediction. Every column is a stated calculation on end-of-day market data, so you can verify what you are looking at.
Each scan date lists only tickers that showed an abnormal volume ratio versus their own baseline — not the whole market.
Each scan date lists only tickers that showed an abnormal volume ratio versus their own baseline — not the whole market.
Each scan date lists only tickers that showed an abnormal volume ratio versus their own baseline — not the whole market.


No. StockScanners.app is a research workspace that organizes scanner-qualified volume events and their price history. It does not recommend trades or predict future performance.
Yes. Registration is free during proof-of-concept access, and no payment details are required.
The dashboard shows tickers that qualified for the scanner on each available trade date based on abnormal volume versus their own baseline.
For every signal, the dashboard measures the lowest adjusted close after the scan and compares it with the current close to show the subsequent recovery path.

Free registration is open while the product is in proof-of-concept access. No payment details required.